

Tile-Level Controls
A tile’s action menu can be accessed by hovering over the top-right corner of a tile.
Downloads
| Action | How |
|---|---|
| Download tile data | 1. Open the tile actions menu and select Download Data. 2. Set the download options to best fit your needs and click the Download button. Available Options: File formats: TXT (Tab-separated), XLS, CSV, JSON, HTML, Markdown, & PNG (image of the visualization) You can choose to download the data with your visualization settings applied or as displayed in the data table. You can choose formatted or unformatted data values. You can choose the number of rows to include. |
| View downloadable data in browser | 1. Open the dashboard actions menu and select Download Data. 2. Set the download options to best fit your needs and click Open in Browser. |
View Settings
| Action | How |
|---|---|
| Enlarge a tile for easier viewing | Open the action menu and select View > Expanded. |
Table Settings
| Action | How |
|---|---|
| Size the columns to the data | Open the tile actions menu and select Auto-size all columns. |
| Reset the default column widths | Open the tile actions menu and select Reset all column widths. |
| View additional information about a particular data value | Where applicable, click the small ellipsis following the data value, and select the dashboard you want to carry the context too. |
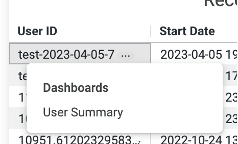
View Additional Info
Dashboard Data vs. API Data
Dashboard data reflects the final outcome of all interactions in the session. If the API is called at different points in the user’s session (e.g., early in the session), API results may slightly differ from dashboard insights.
Updated over 1 year ago