

Integration Health Report
NeuroID Mobile SDKs have the ability to generate an Integration Health Report that will validate whether your integration is instrumented properly. Please see below for instructions on generating this report for each platform.
<v3.1.0 - Not available when Production Environment is set to true
Important: This report may ONLY be generated when
setEnvironmentProduction(false)is called. The NeuroID SDK will not generate an Integration Health report if this value istrue.
Node.js is required to view the report
Viewing the Report
Instructions for iOS
v3.4.2+ The Integration Health Report has been removed
In the iOS SDK v3.4.2+, the Integration Health Report has been removed. The following method setVerifyIntegrationHealth() have been deprecated. Please remove the usage of this method from your application.
v3.4.1+ Requires the installation of the
'NeuroID/Debug'ModuleIn addition to the
'NeuroID'module installed in the Podfile, please install'NeuroID/Debug'to allow the Integration Health Report to be loaded. This module does not need to be installed for production releases.
To signify that you would like to verify the integration health of your application, call the setVerifyIntegrationHealth method with a parameter of true after you call the configure method.
// ... Other parts of your code
NeuroID.configure(clientKey: "YOUR_KEY")

NeuroID.setVerifyIntegrationHealth(true) // This will signal the sdk to generate the report.
// ... Other parts of your code
NeuroID.configure(clientKey: "YOUR_KEY")
NeuroID.setEnvironmentProduction(false) // MUST BE FALSE

NeuroID.setVerifyIntegrationHealth(true) // This will signal the sdk to generate the report.
After you have called setVerifyIntegrationHealth and build and run your project, you will see instructions printed in the console that direct you to where the report is located and how to view it.
ℹ️ NeuroID Integration Health Instructions:
1. Open a terminal command prompt
2. Cd to /Users/YOU_USER/PATH_TO_REPORT
3. Run `node server.js`
4. Open a web browser to the URL shown in the terminal
After starting the server.js script, you can navigate to the local port number in a web browser (http://localhost:5492) to see the report generated. Because iOS allows the SDK to continually update the report, you can click the "Live Tail" button to see a continuous stream of events as they are occurring (updated every 5 seconds).
Note: If you find it difficult to spot the automatically generated console output, you may reprint the directory information by calling the printIntegrationHealthInstruction method included in the SDK. This enables you to print the information in your console where it would be most visible. You may also search in your logs for NeuroID Integration Health Instructions.
NeuroID.printIntegrationHealthInstruction()
Instructions for Android
v3.5.2+ The Integration Health Report has been removed
In the Android SDK v3.5.2+, the Integration Health Report has been removed. The following method setVerifyIntegrationHealth() have been deprecated. Please remove the usage of this method from your application.
v3.5.1+ Debug Build Only
The Integration Health Report is only bundled in the
debugbuild of the SDK. Please use that build variant to utilize the report. This build does not need to be installed for production releases and the release build can be used instead.
To signify that you would like to verify the integration health of your application, call the setVerifyIntegrationHealth method with a parameter of true after you call the Builder method.
val neuroId = NeuroID.Builder(
            this,
            "YOUR_KEY"
        ).build()
NeuroID.setNeuroIdInstance(neuroId)
NeuroID.getInstance()?.setVerifyIntegrationHealth(true) // This will signal the sdk to generate the report.
val neuroId = NeuroID.Builder(
            this,
            "YOUR_KEY"
        ).build()
NeuroID.setNeuroIdInstance(neuroId)
NeuroID.getInstance()?.setEnvironmentProduction(false) // MUST BE FALSE
NeuroID.getInstance()?.setVerifyIntegrationHealth(true) // This will signal the sdk to generate the report.
After you have called setVerifyIntegrationHealth and build and run your project, you will see instructions printed in the console that direct you to where the report is located and how to view it.
ℹ️ NeuroID Integration Health Instructions:
1. Open Android Studio
2. Go to View -> Tool Windows -> Device File Explorer
3. Select your emulator and navigate to `data/data/YOUR_APP_NAME/files/nid`
4. Right click on the `nid` directory and save to a local folder on your system
5. Open a terminal prompt
6. Cd to the directory you just saved the folder to
7. Cd to `nid`
8. Run `node server.js`
After starting the server.js script, you can navigate to the local port number in a web browser (http://localhost:5492) to see the report generated.
Because the Android Emulator does not allow access to the emulator file system directly from the terminal, you will only be able to see the events at snapshot moments and will need to keep copying the integrationHealthEvents.json file to your local nid directory. Alternatively, you may wait until you have completely walked through your application, then (after you have finished) copy the final JSON file to your local directory and run the report.
Note: If you find it difficult to spot the automatically generated console output, you may reprint the directory information by calling the printIntegrationHealthInstruction method included in the SDK. This enables you to print the information in your console where it would be most visible. You may also search in your logs for NeuroID Integration Health Instructions.
NeuroID.getInstance()?.printIntegrationHealthInstruction()
Instructions for React-Native
v3.4.1+ The Integration Health Report has been removed
In the ReactNative SDK v3.4.1+, the Integration Health Report has been removed. The following method setVerifyIntegrationHealth() have been deprecated. Please remove the usage of this method from your application.
To signify that you would like to verify the integration health of your application, call the setVerifyIntegrationHealth method with a parameter of true after you call the configure method.
// ... Other parts of your code
NeuroID.configure(clientKey: "YOUR_KEY")

NeuroID.setVerifyIntegrationHealth(true) // This will signal the sdk to generate the report.
// ... Other parts of your code
NeuroID.configure(clientKey: "YOUR_KEY")
NeuroID.setEnvironmentProduction(false) // MUST BE FALSE

NeuroID.setVerifyIntegrationHealth(true) // This will signal the sdk to generate the report.
After you have called setVerifyIntegrationHealth and build and run your project, you will see instructions printed in the console that direct you to where the report is located and how to view it.
Check the Native Console Not React-Native or Metro Terminal
The instructions for the Integration Health Report will be printed using the underlying Swift or Kotlin code. Because of this, it might be necessary to run your application in Xcode or Android Studio and see the logs there rather than through the normal React-Native or Metro terminal window that shows your javascript
console.logstatements.
Integration Health Report Overview
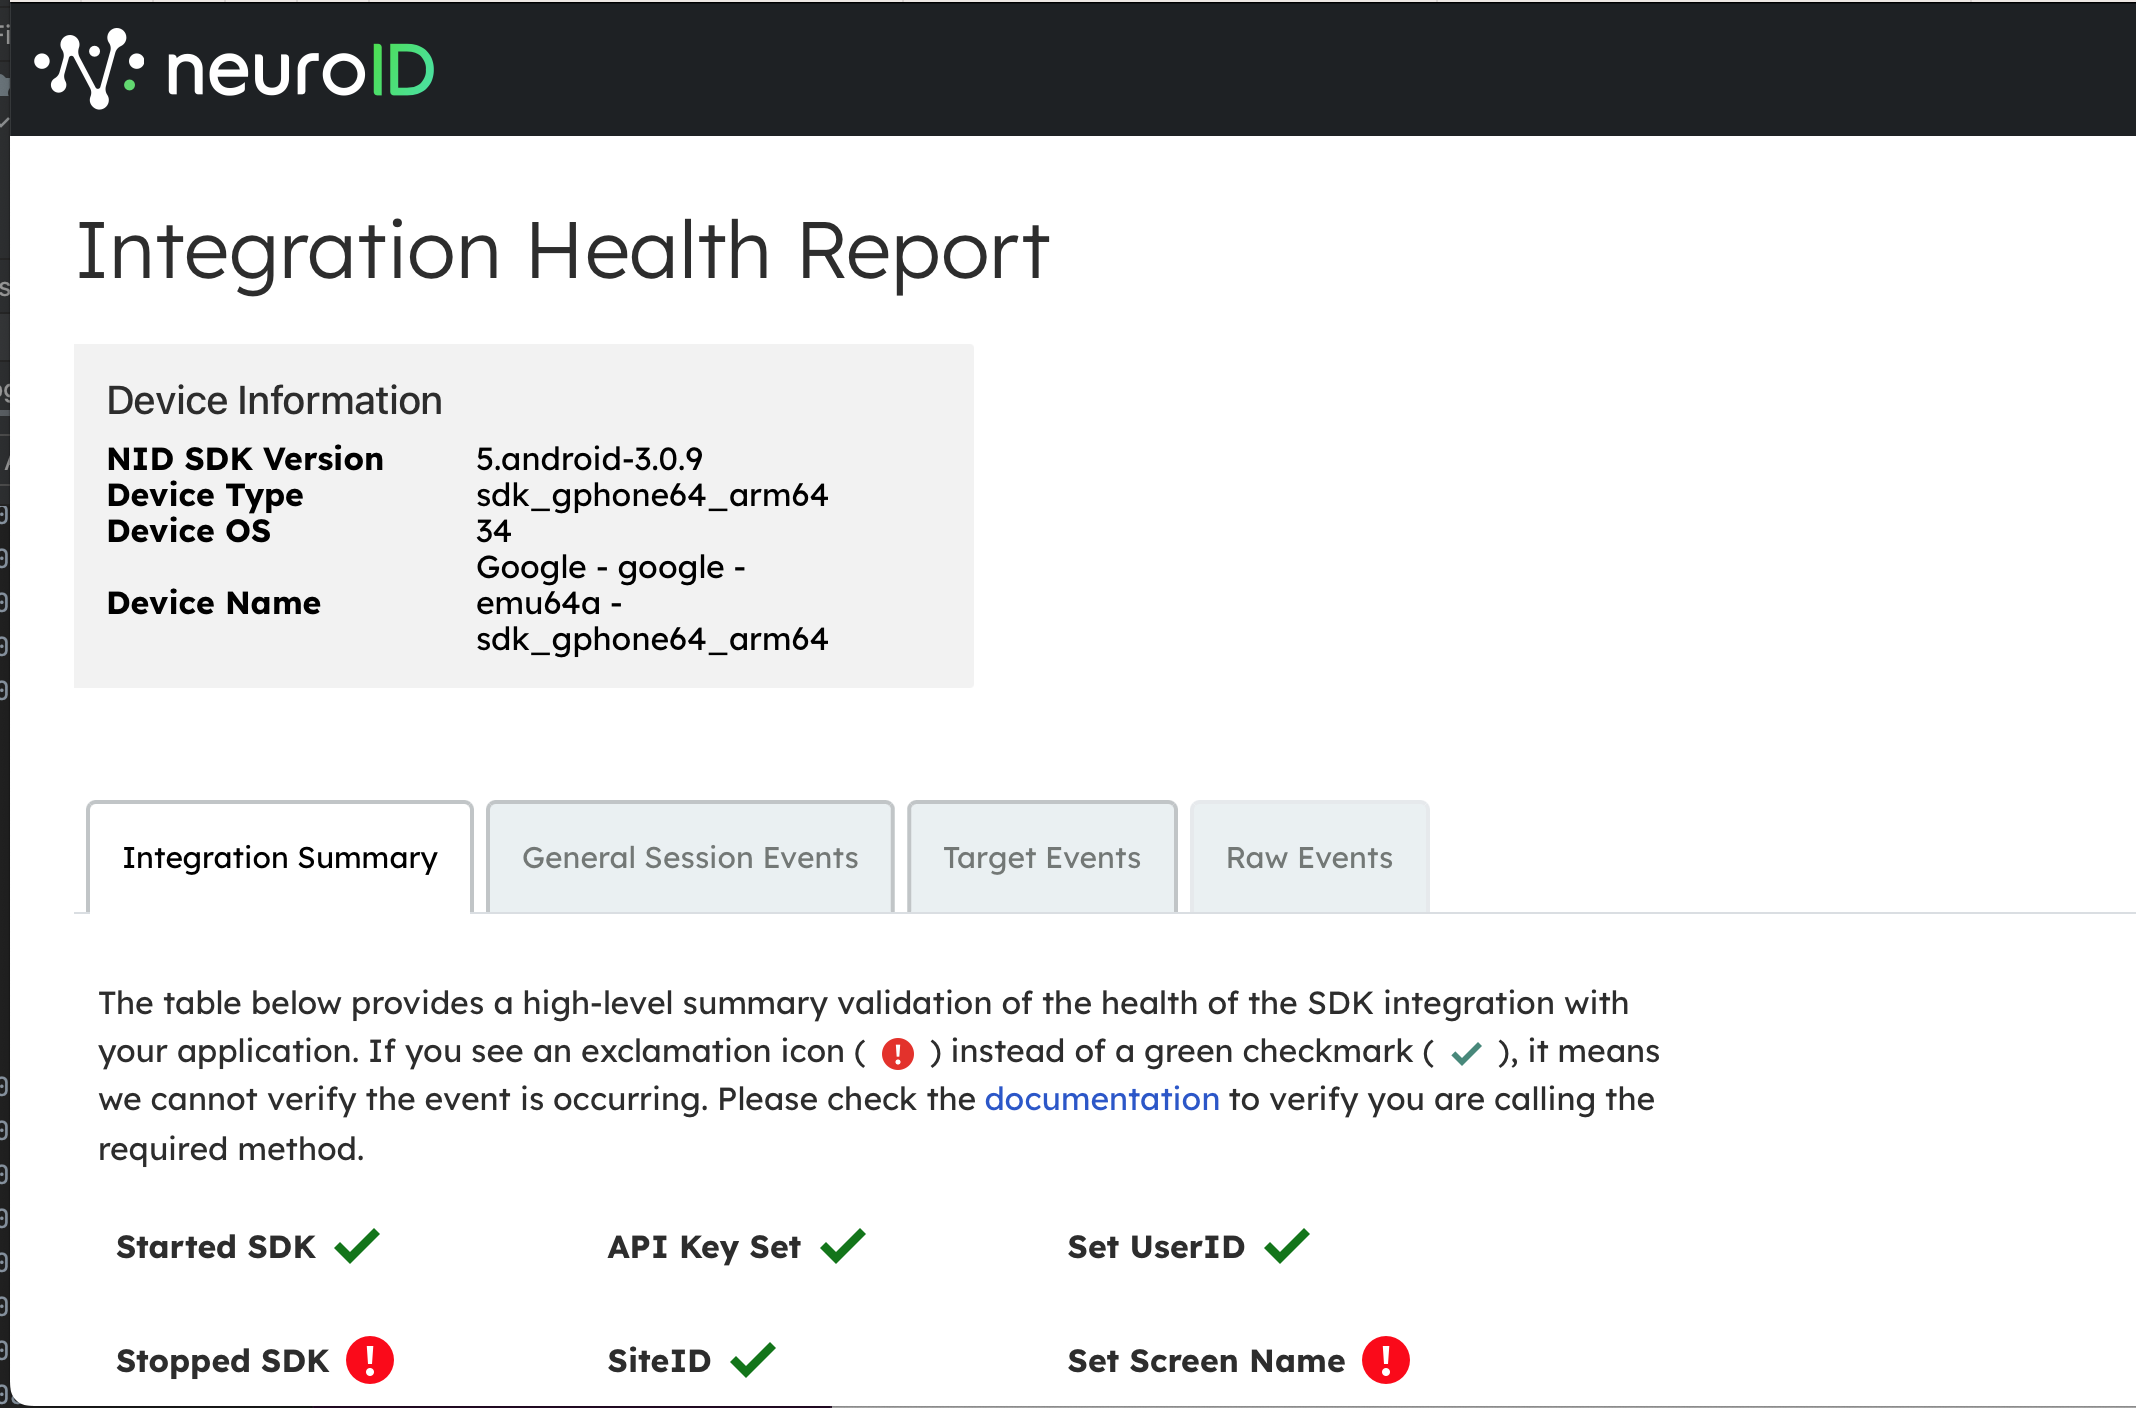
Integration Health Report Preview
The Integration Health Report is separated into multiple sections, each focused on providing guidance specific to that area. A brief description of each is given below, along with some helpful tips on how to use each section.
Integration Summary
This tab includes both a Summary Report of your integration and any targets where NeuroID has detected a problem.
Summary Report
This table provides a high-level summary validation of the health of the SDK integration with your application. If you see an exclamation icon instead of a green checkmark, it means we cannot verify the event is occurring.
Key Integration Health Events:
- Started SDK - Verified that the SDK
startcommand was called and started tracking a session. - API Key Set - Verified that an API Key (also called a
clientKey) has been set (should happen in the configure/builder of theNeuroIDobject). - Set UserID - Verified that the
setUserIDcommand was called, and a userID has been set for the session. - SiteID is Present - Verify that the
setSiteIdcommand was called and a siteID has been set. - Set Screen Name - Verify that targets coming in have a screen name associated with them (see the
setScreenNamecommand for your respective platform). - Stopped SDK - Verify that the SDK
stopcommand was called and ended a session.
Targets With Errors/Warnings
This panel will list targets that are missing events or have warnings. If you see an exclamation icon, it means the target is missing a required event type. If you see a warning icon, there is a potential problem with the target, e.g., a Missing ID warning would indicate that the target's accessibility identifier has not been set correctly.
General Session Events
This tab displays a table containing a count of the required session-level events and the timestamp of the last event.
Target Events
This tab has a table that displays a list of targets found and each target's associated key event counts. Certain event combinations are required for each field type in order to verify it is observed correctly. The Type table lists the Field Type and the associated Required Events.
For each Field Type there are certain event combinations needed to verify it is being observed correctly. Please use the following as a legend to determine the necessary events
Type Table:
| Type | Required Events |
|---|---|
| Text | Registered, Blur, Focus, Input, Text Change |
| Selector | Registered, Input Change |
The type may show as Unknown for events with no specific target.
Raw Events
This tab contains a table with a list of the raw events and several helpful fields extracted for easy sorting and review. Use this table to order the events by timestamp to follow the flow of received events or sort and filter by Target, URL, or Event Type. The last column displays the raw event in a JSON string format.
Exporting and Transferring Session Data to the NeuroID Team
There may be cases where you would like to send your session information to the NeuroID team so we can help analyze and perform additional troubleshooting. In that case, you can navigate to the same directory where you run node server.js (See instructions for Viewing the Report) and send both the integrationHealthEvents.json file and the integrationHealthDetails.json file to the NeuroID support team. Using these two files, the NeuroID team will be able to view your session and provide the added support and guidance needed.
Updated over 1 year ago